
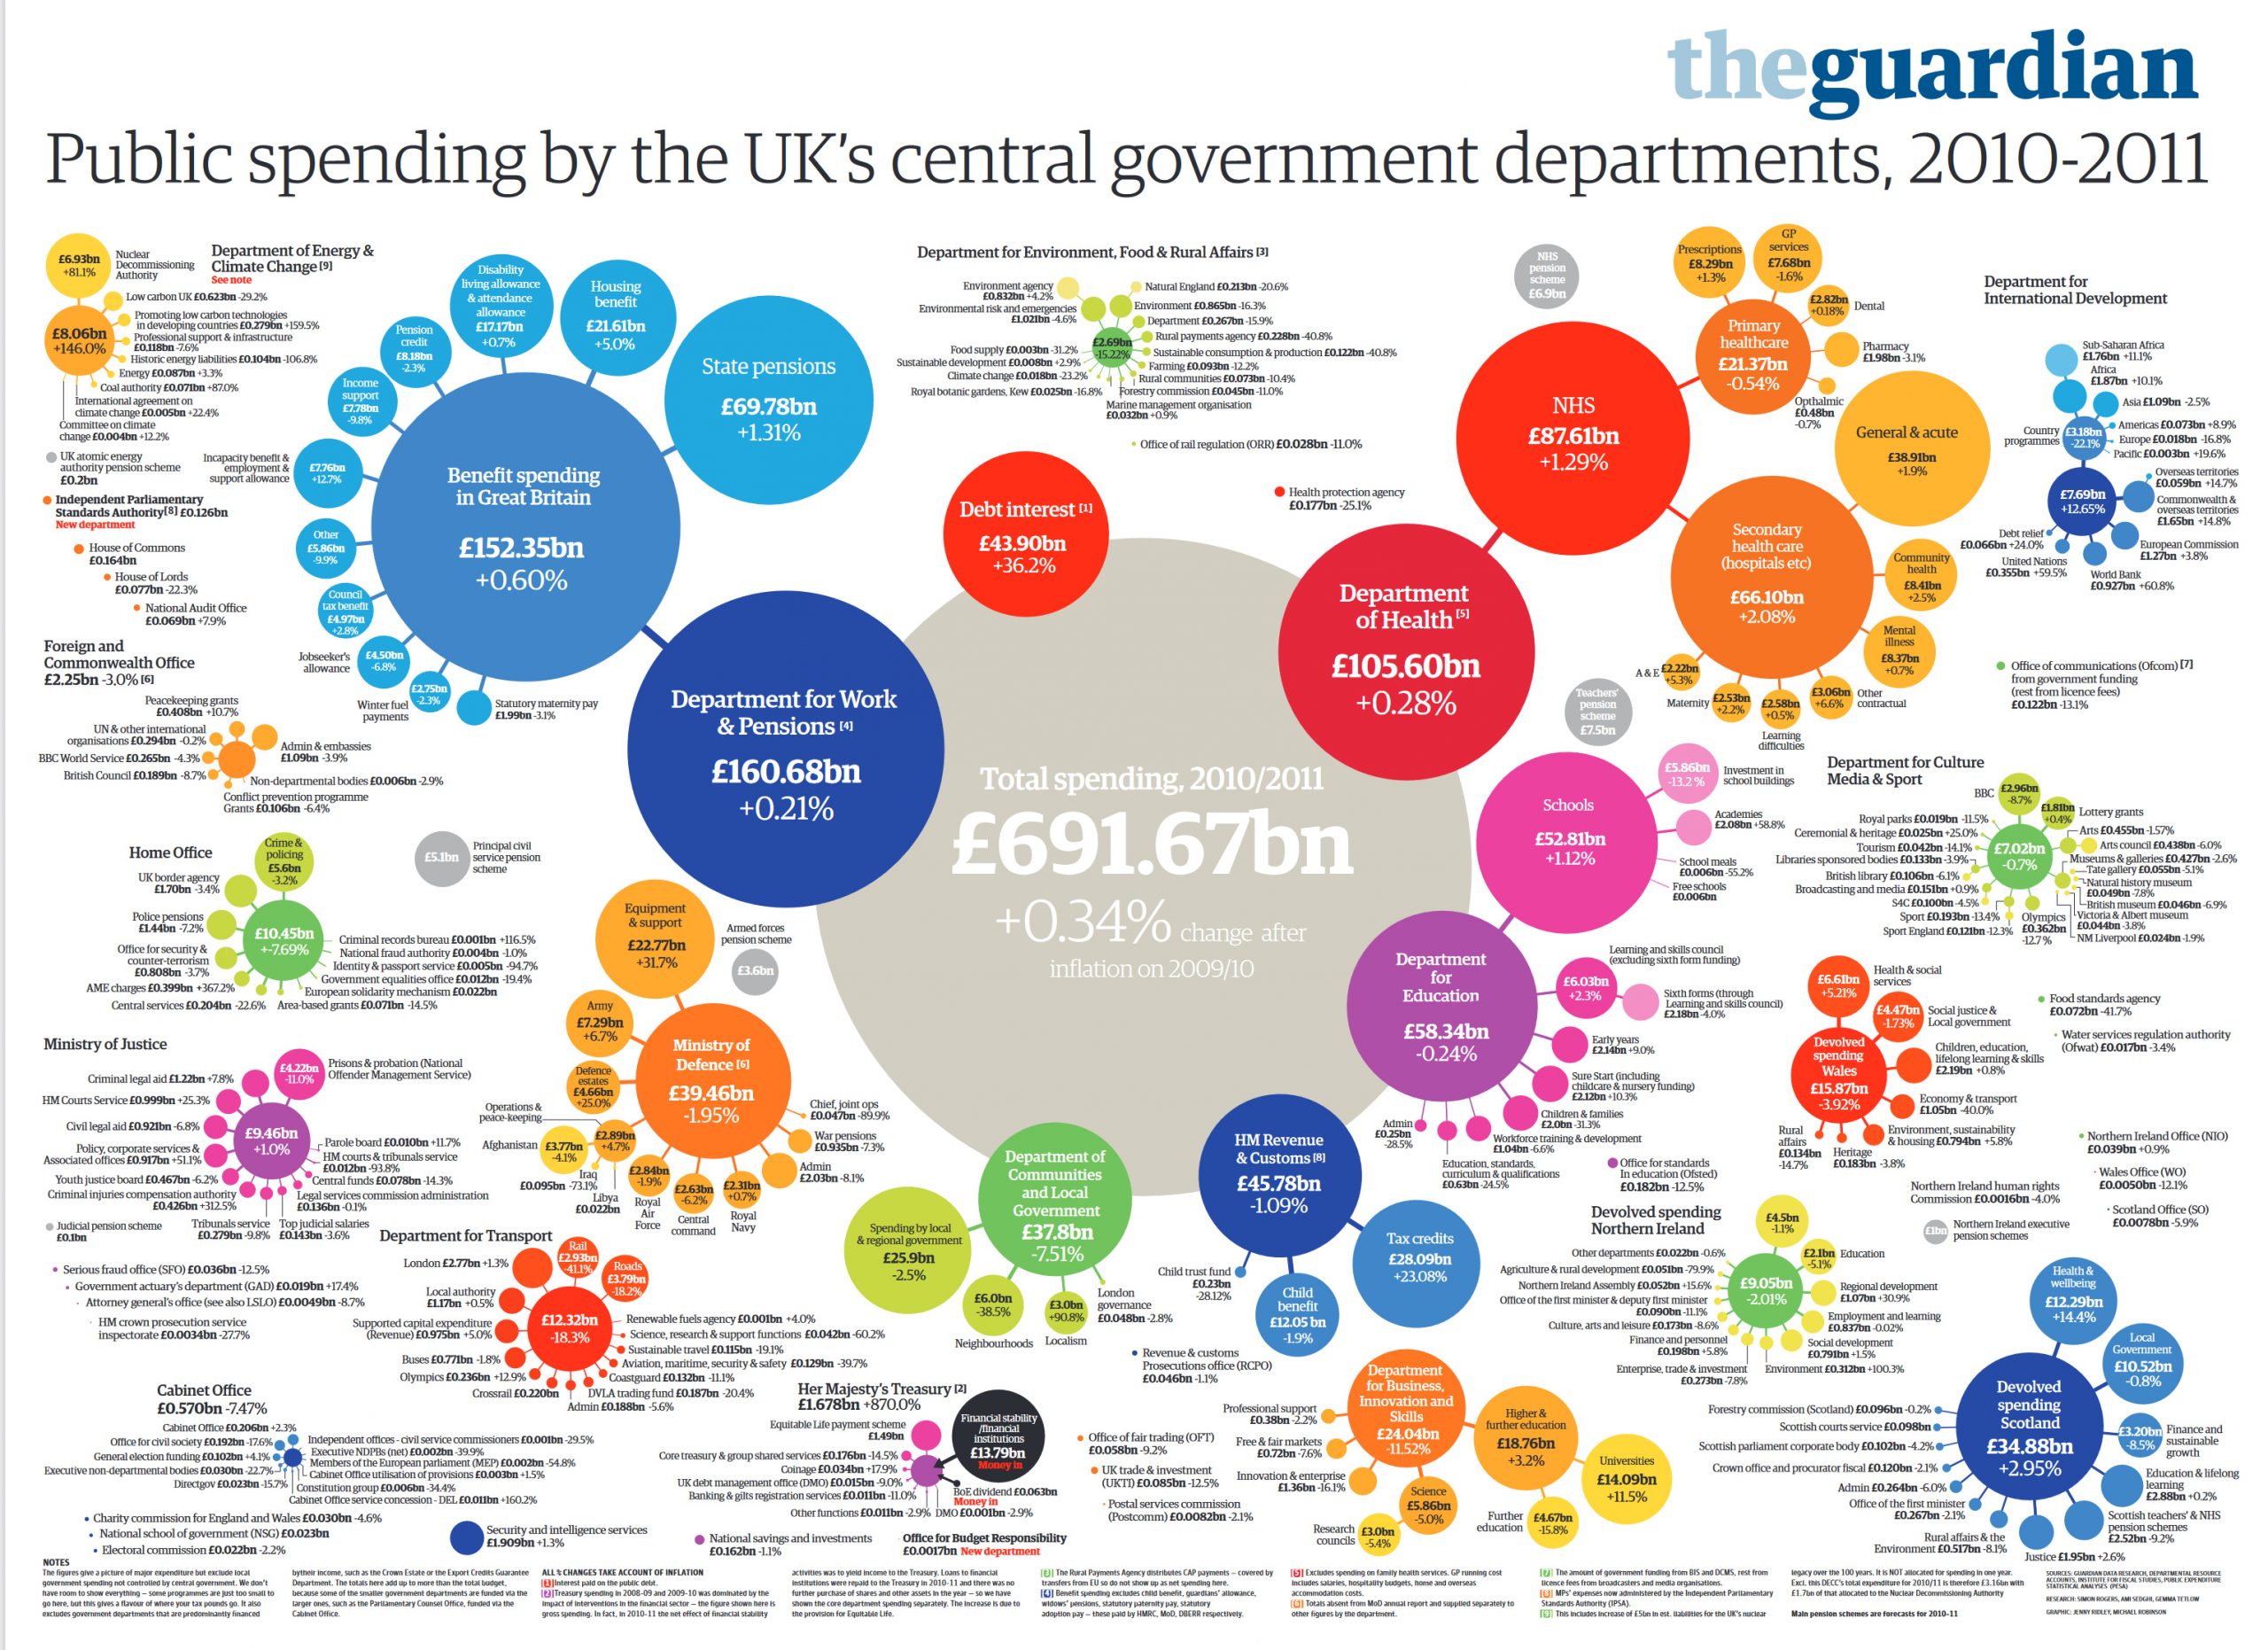
This is the public spending for ten years ago 2010-2011:
Source: https://www.theguardian.com/news/datablog/2011/oct/26/government-spending-department-2010-11, accessed 12th Dec 2021
Does anyone dare to make a chart for 2019-2020?
Note that the unemployment expenditure is very low compared to other costs in this chart.